Team activity
Who's messaging, calling, and sending, and when.
The Team activity report shows the human side of the operation: how much your team communicates and when.
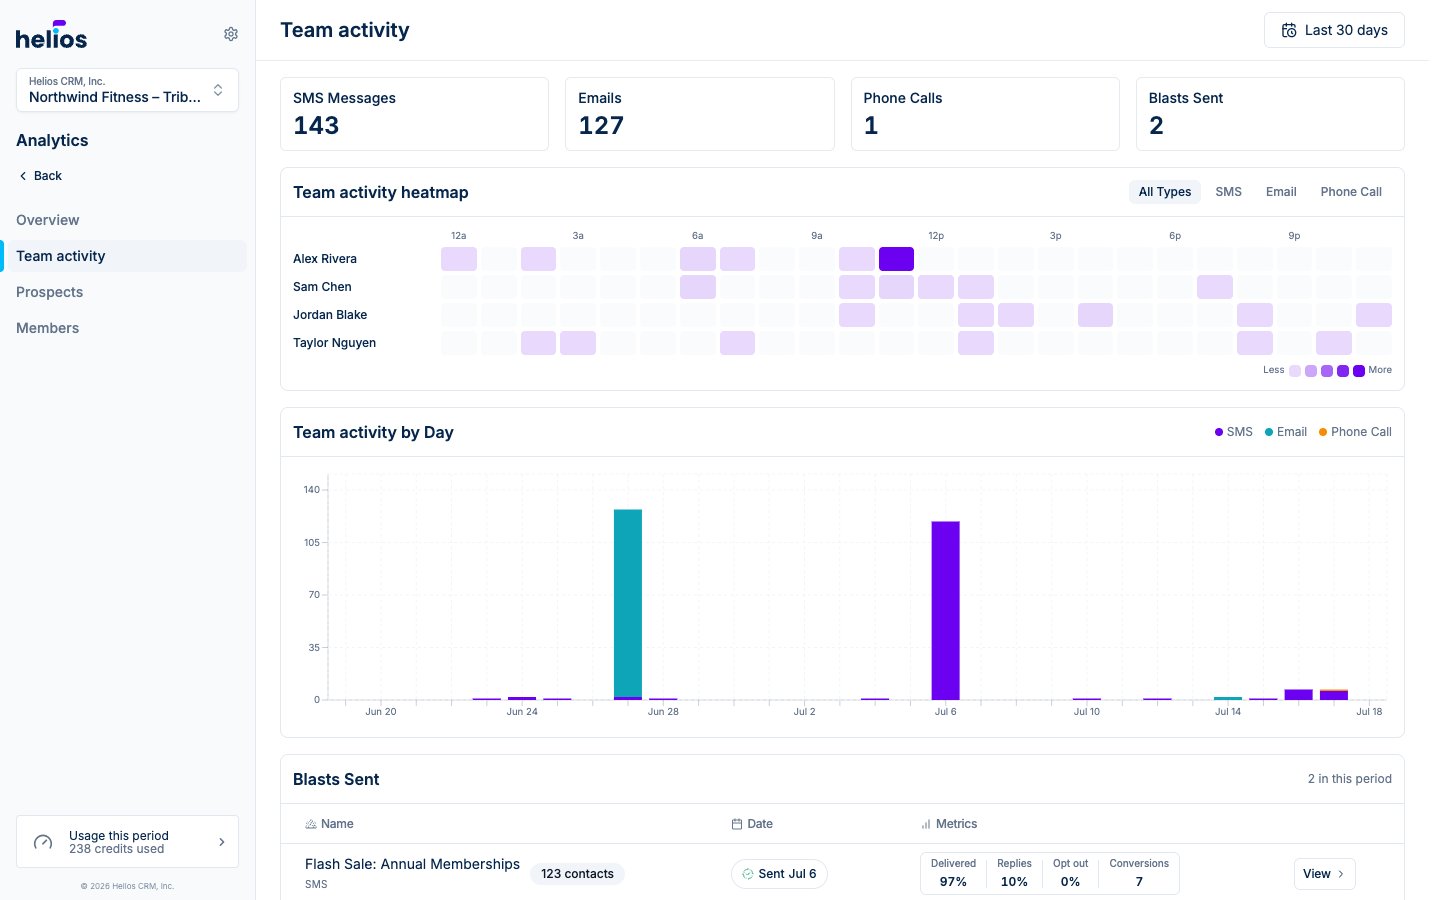
The metrics
- SMS Messages, Emails, and Phone Calls: total volume for the period, per channel.
- Blasts Sent: campaigns that went out.
Each compares against the previous period.
The heatmap
Team activity heatmap plots each teammate’s activity by hour of day: darker means more active. Automated appears as its own row, so you can see how much of your messaging is flows versus humans. Filter by channel with the All Types / SMS / Email / Phone Call pills.
Ways to read it:
- Coverage gaps: if leads text at 7 PM but the heatmap goes cold at 5, messages sit unanswered overnight. That’s an argument for an after-hours auto-reply (Working Hours) or shifted coverage.
- Automation share: a strong Automated row means your flows are carrying real load; a silent one means you’re doing everything by hand.
Activity by day
The Team activity by Day chart stacks SMS, email, and calls per day across the period, the quickest way to see whether volume is trending up and which channel is driving it.