Overview report
Revenue, contacts, message usage, and the sales funnel at a glance.
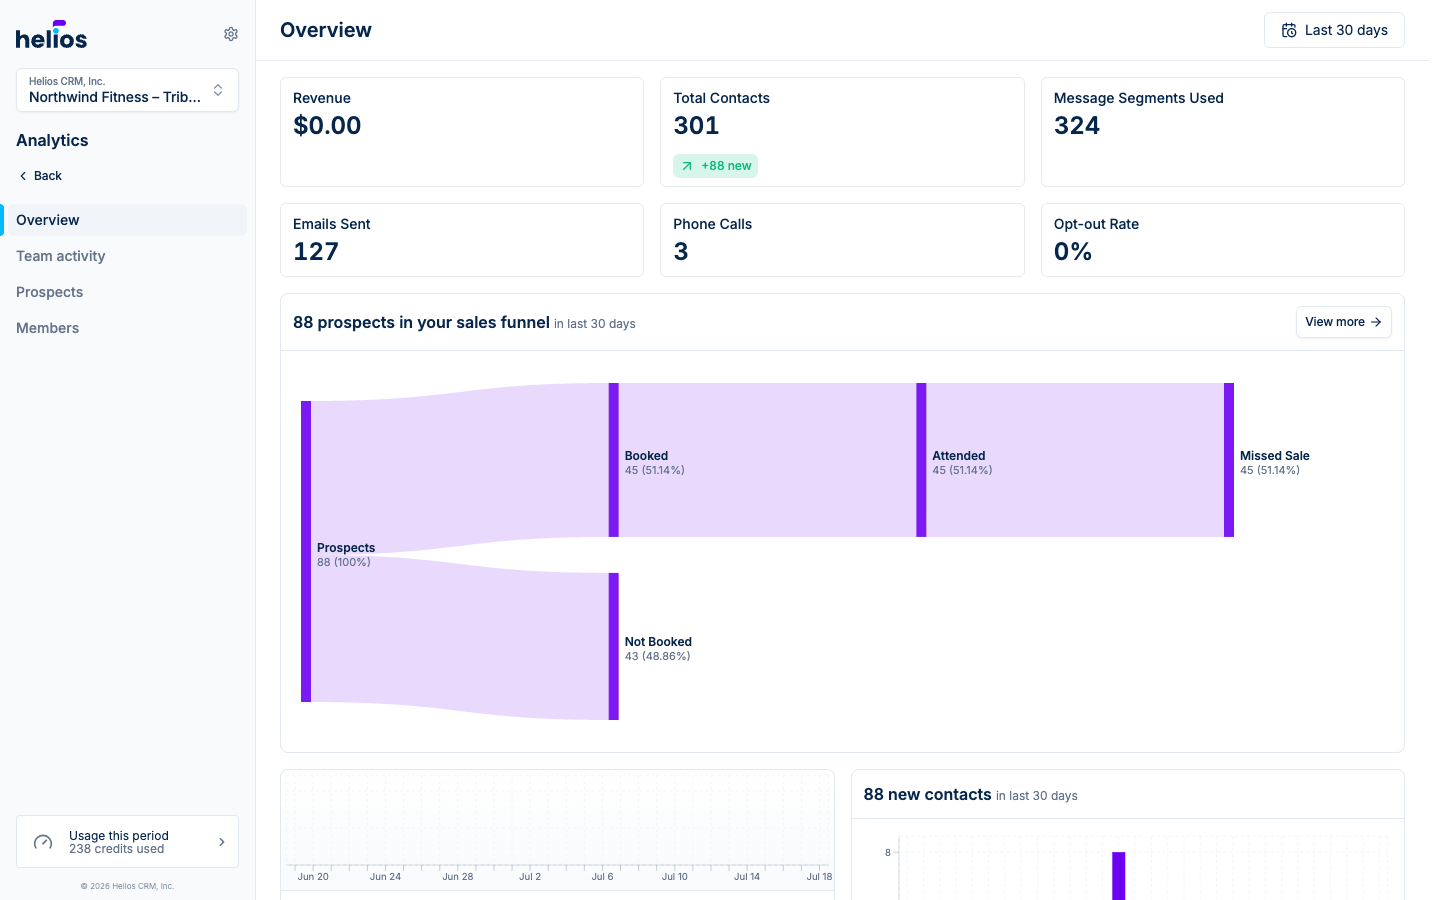
Reports in the sidebar opens the Overview, the health check for your whole operation.
Date range
Every report shares the picker in the top right: Last 7 days, Last 14 days, Last 30 days (default), Month to date, Year to date, Last 12 months, or a custom range. Each stat shows a comparison against the previous period of the same length.
The metrics
| Card | What it measures |
|---|---|
| Revenue | Sales attributed in the period, from your connected integrations. |
| Total Contacts | Your contact count, with how many are new this period. |
| Message Segments Used | SMS segments sent. This is what consumes credits. |
| Emails Sent | Email volume for the period. |
| Phone Calls | Calls made and received. |
| Opt-out Rate | Share of recipients who unsubscribed. Keep an eye on this after big blasts. |
The sales funnel
With a fitness integration connected (Mariana Tek, Mindbody, or fitDEGREE), the Overview shows “N prospects in your sales funnel”: a flow diagram from Prospects through Booked / Not Booked, Attended, and outcomes like Started a Membership or Purchased a Package. Click View more for the full Prospects report.
Below the funnel, the Sales panel and new contacts chart track daily volume across the period.
Reading it weekly
A useful cadence: check the Overview every Monday on Last 7 days.
- Opt-out rate creeping up? Your sends may be too frequent or too broad. Tighten your segments.
- Contacts up but revenue flat? Leads are arriving but not converting. Look at the funnel’s Not Booked band and consider a follow-up flow.
- Segments used spiking? Long messages split into multiple segments; trimming blast copy saves real money.