The Inbox dashboard
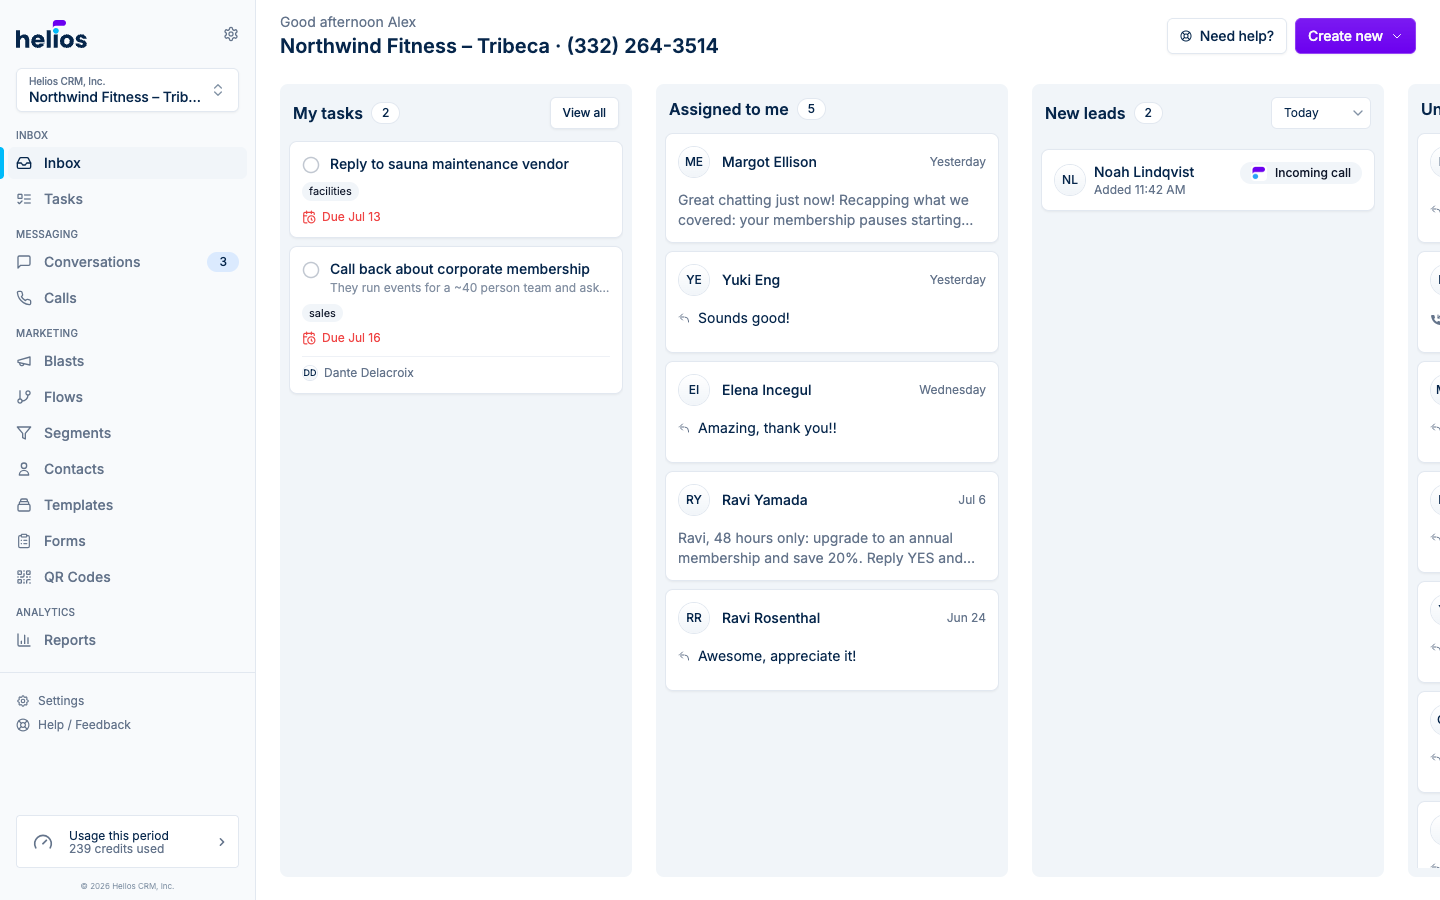
A kanban of what needs attention right now: new leads, unanswered threads, and follow-ups.
The Inbox page (the first item in the sidebar) is your team’s daily starting point. Instead of an undifferentiated list, it organizes work into columns so you always know what needs attention.
The columns
| Column | What lands here |
|---|---|
| New leads | Contacts created within the selected time range. These are people you haven’t built a relationship with yet, so answer them fast. |
| Unanswered | Threads where the customer sent the last message. The ball is in your court. |
| Assigned to you | Threads you own. Only you get notifications for these. |
| Needs follow up | Threads where your team sent the last message and is waiting on a reply. |
| My tasks | Your open tasks (to do and in progress) with a View all link to the Tasks page. |
Click any card to jump straight into that conversation.
The time-range filter
The New leads column has its own time filter: Today, 1 day, 3 days, 7 days, or 30 days. It defaults to Today and remembers your choice.
Create new
The Create new button in the top right starts common actions without leaving the dashboard:
- Blast: a one-time campaign to a list or segment
- Conversation: a new 1 thread
- Contact list: a new static list
- Task: a to-do for your team, opened in the New task dialog
Credits at a glance
The bottom of the sidebar shows your usage this period (for example, “3 of 10K credits used”). Click it to see billing details.